'Graphical Analysis™ is a powerful tool for creating and analyzing graphs for science and math students. Use Graphical Analysis to create graphs, modify scaling, make selections, create annotations and captions, and perform analysis with statistics and curve fits. Students can manually enter x,y data into a table, collect data using the built-in accelerometers, or connect wirelessly to a Vernier LabQuest 2 to work with Vernier sensors.
Using Graphical Analysis with Vernier Sensors
Using a Vernier LabQuest 2 sensor interface or a computer running Logger Pro 3 (version 3.8.6 or newer), students can wirelessly connect to these data sources and view experimental data from Vernier sensors in a table or a graph. Multiple members of a lab group can connect at the same time while collecting data from any of over 80 compatible Vernier sensors. For more information, visit: www.vernier.com/css
As needed, students can export data and graphs to create a lab report or send their finished work to the instructor. Students can export graphs to the Photo Gallery, Mail, Google Drive™, and third-party apps or print using an available printer. A CSV file of the data can be exported to third-party apps, email, or Google Drive.
Key features
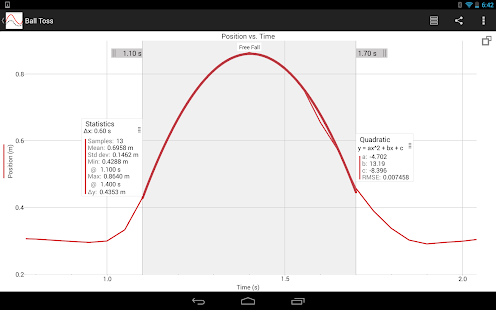
• Display 1 or 2 graphs • Access data table with row-by-row entry and multiple columns • Auto-save data, graphs, annotations, statistics and curve fits • Draw predictions on a graph • Pinch to scale graph • Examine and select data • Perform curve fits, including linear, quadratic, natural exponent, and more • Create text annotations • Create graph titles • Export graphs and data • Explore included sample data files
Additional features when used with LabQuest 2 and Logger Pro
• Connect multiple student devices to a single data source via wireless networking • Collect data from multiple sensors simultaneously • Start/stop data collection remotely • Use with over 80 compatible Vernier sensors • Display sensor data as graphs or in a table'
This app costs $4.99