
Reading Apprenticeship Inspired Assignment or Lesson
Reading Apprenticeship Inspired Assignment or Lesson
This activity was developed for a workshop for students who are interested in becoming math and science teachers. We used the framework of the New York Times’ “What’s Going on in this Graph?”. Every week of the school year, New York Times shares a different graph, map, or chart form the New York Times and invites students to share what they notice and wonder about it, via a series of questions. This activity encourages students to analyze concepts in mathematics and statistics in a real-world context and to analyze visual journalism.
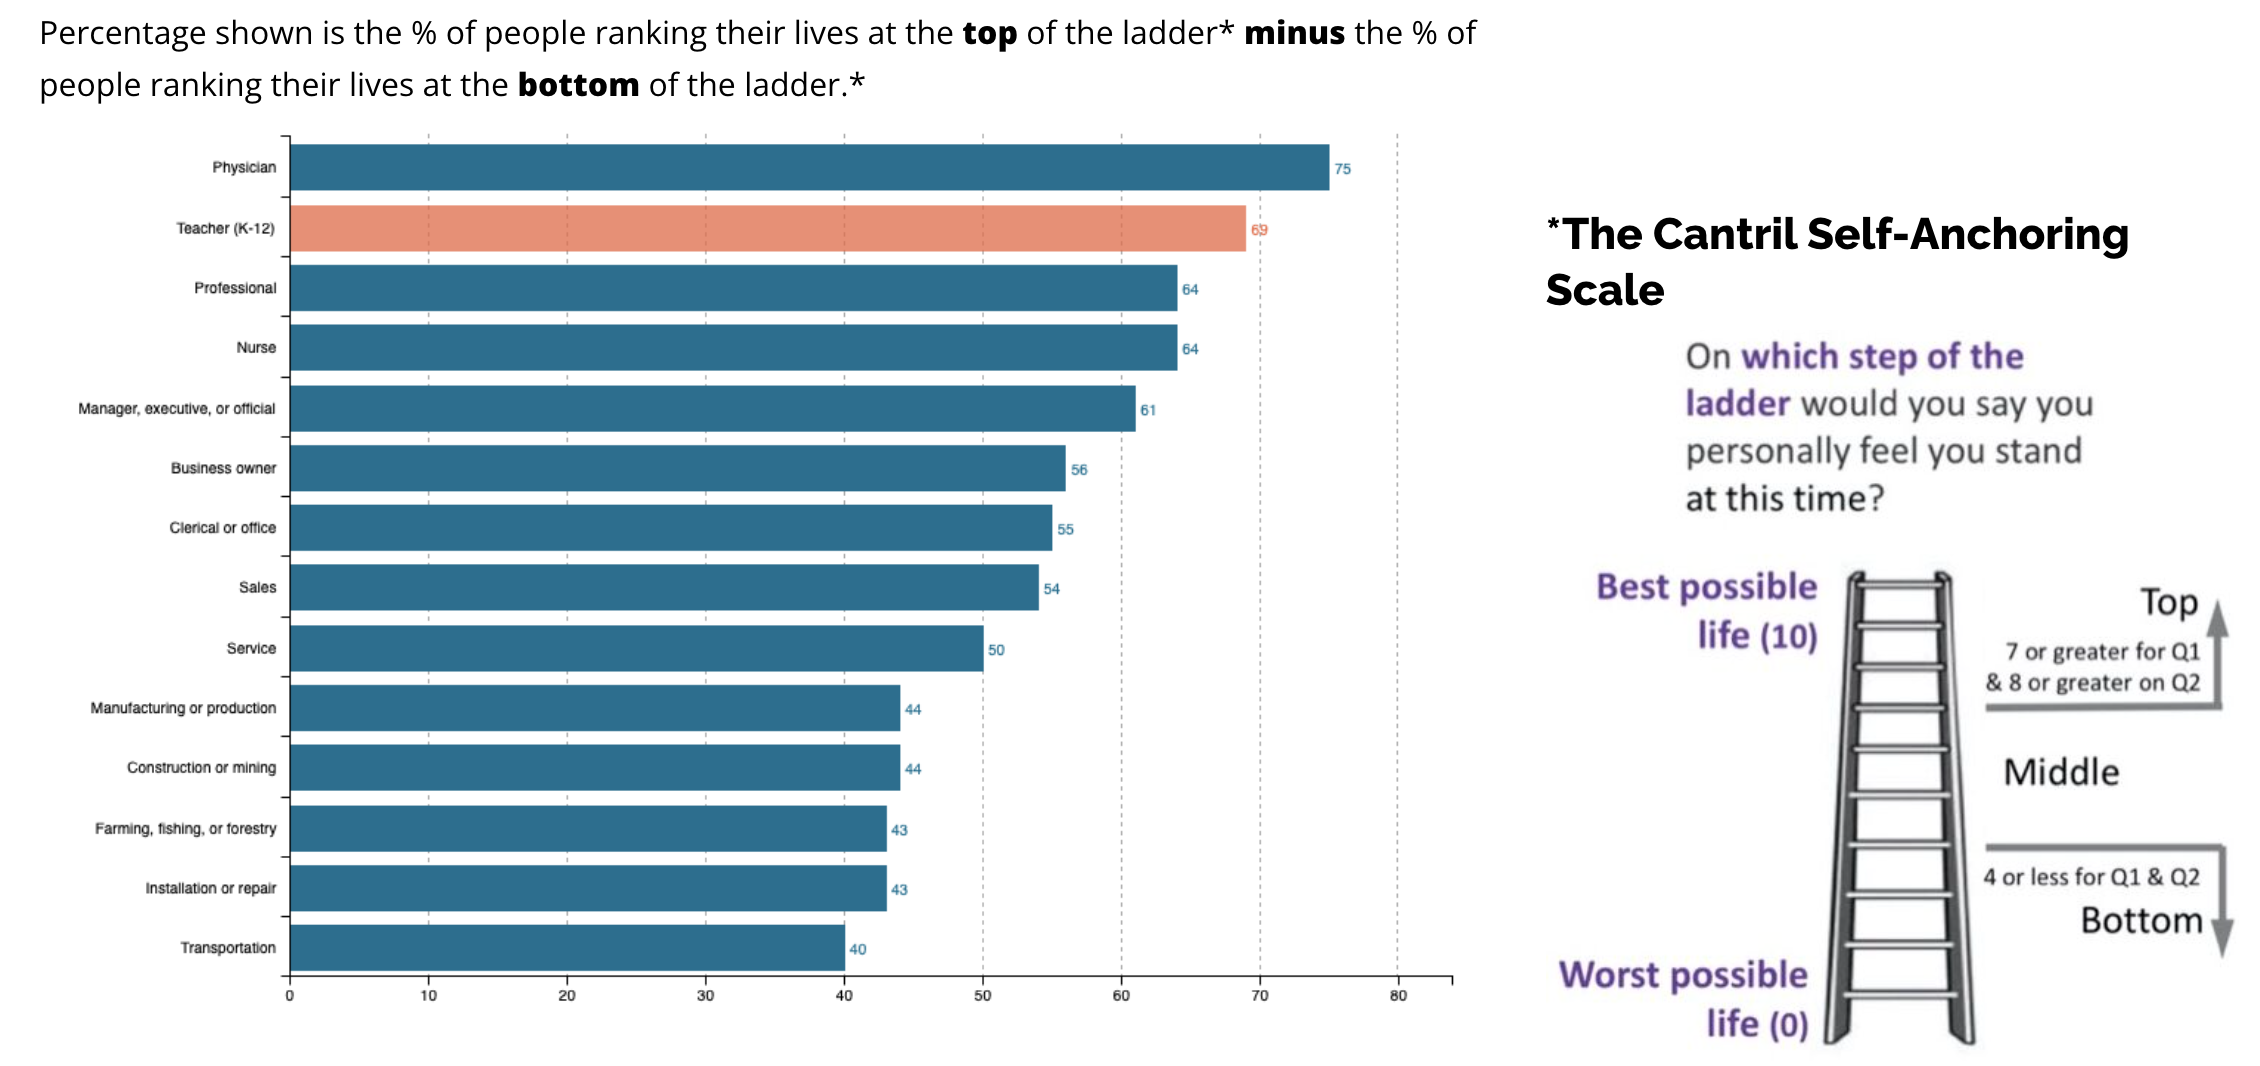
The goal of the Get the Facts Out initiative is to recruit students into teaching mathematics at the secondary (middle and high school) level. As part of this, the researchers have collected data to dispel or disprove some of the persistent myths and misconceptions surrounding teaching as a career. For example, the figure below was created from the Gallup-Healthways Well-Being Index survey with a random sample of 172,286 workers, aged 18 or over. Image Source: Get the Facts Out.
For this activity, I used graphs from Get the Facts Out, then asked students to think aloud on them using the question prompts from New York Times’ What’s Going on in this Graph. The purpose of the activity was to 1) make sense of the information presented by Get the Facts Out and 2) use it to inform a conversation about the teaching profession.
Because this activity was outside of a classroom setting, we did not assume that students had any particular content or metacognitive practice before the activity.
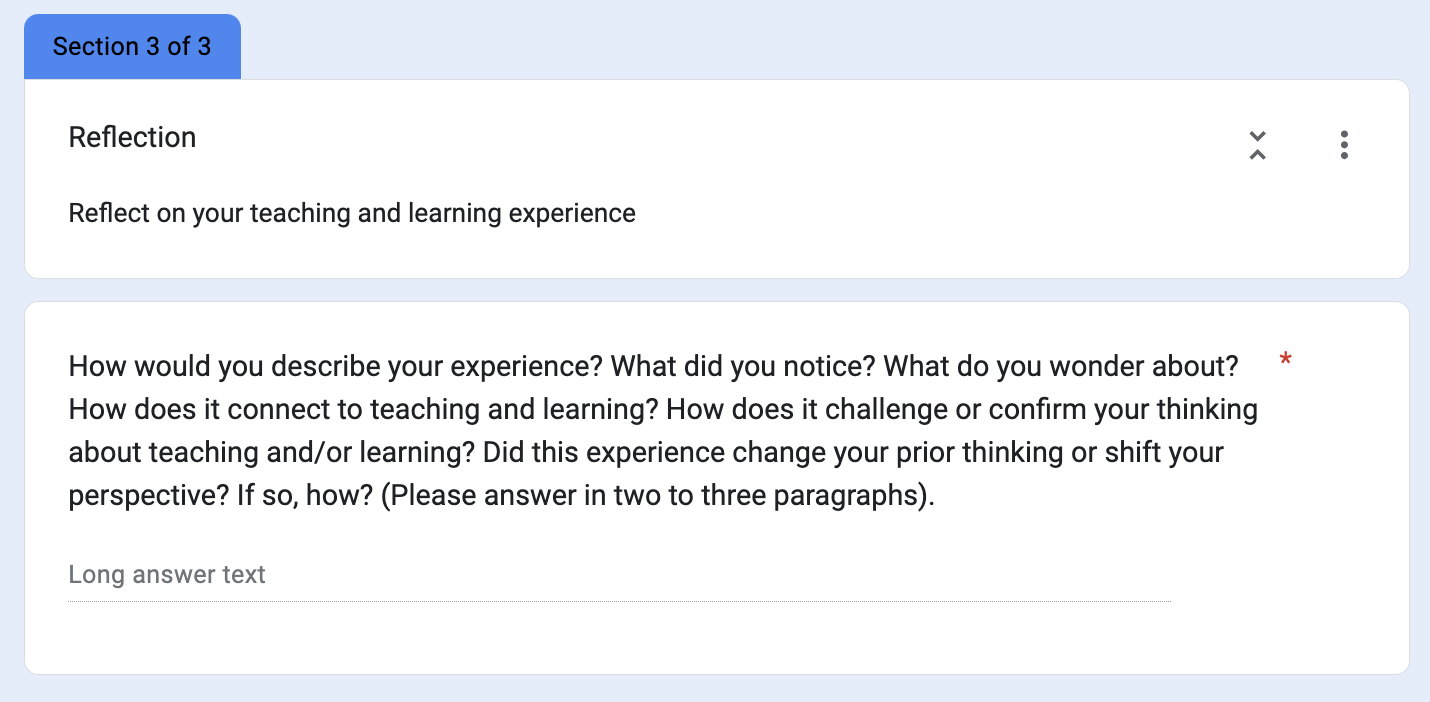
Students were asked to complete a reflection form after the workshop, including reflections on this activity. A screenshot of the reflection form is included below.
The questions in What’s Going on in this Graph? are a notice and wonder prompt. Notice and wonder is an excellent first step into metacognitive conversation. Any student can participate, regardless of their background or content knowledge.
We ran this in person, but it could be asynchronous using a discussion board also. We gave each group of students one of the graphs. The students talked in their groups, then shared highlights of their discussion with the larger group. It took about five minutes for the initial group discussion, and perhaps fifteen minutes for the group share-out.

