Population Ecology
Population Ecology
A population is a group of individuals of the same species living in the same. As a result they can easily interbreed. If you have another group of organisms of that same species but who are reproductively isolated from the first group, then that constitutes a separate population. Each population has a set of characteristics:
1. The population size is the number of individuals making up its gene pool.
2. Age structure defines the relative proportions of individuals of each age—especially with respect to reproductive years and potential—the reproductive base.
3. Population density is the number of individuals per unit of area or volume—the habitat.
4. Population distribution refers to the general pattern in which the population members are dispersed through its habitat.
A quick overview of population ecology can be found at this page.
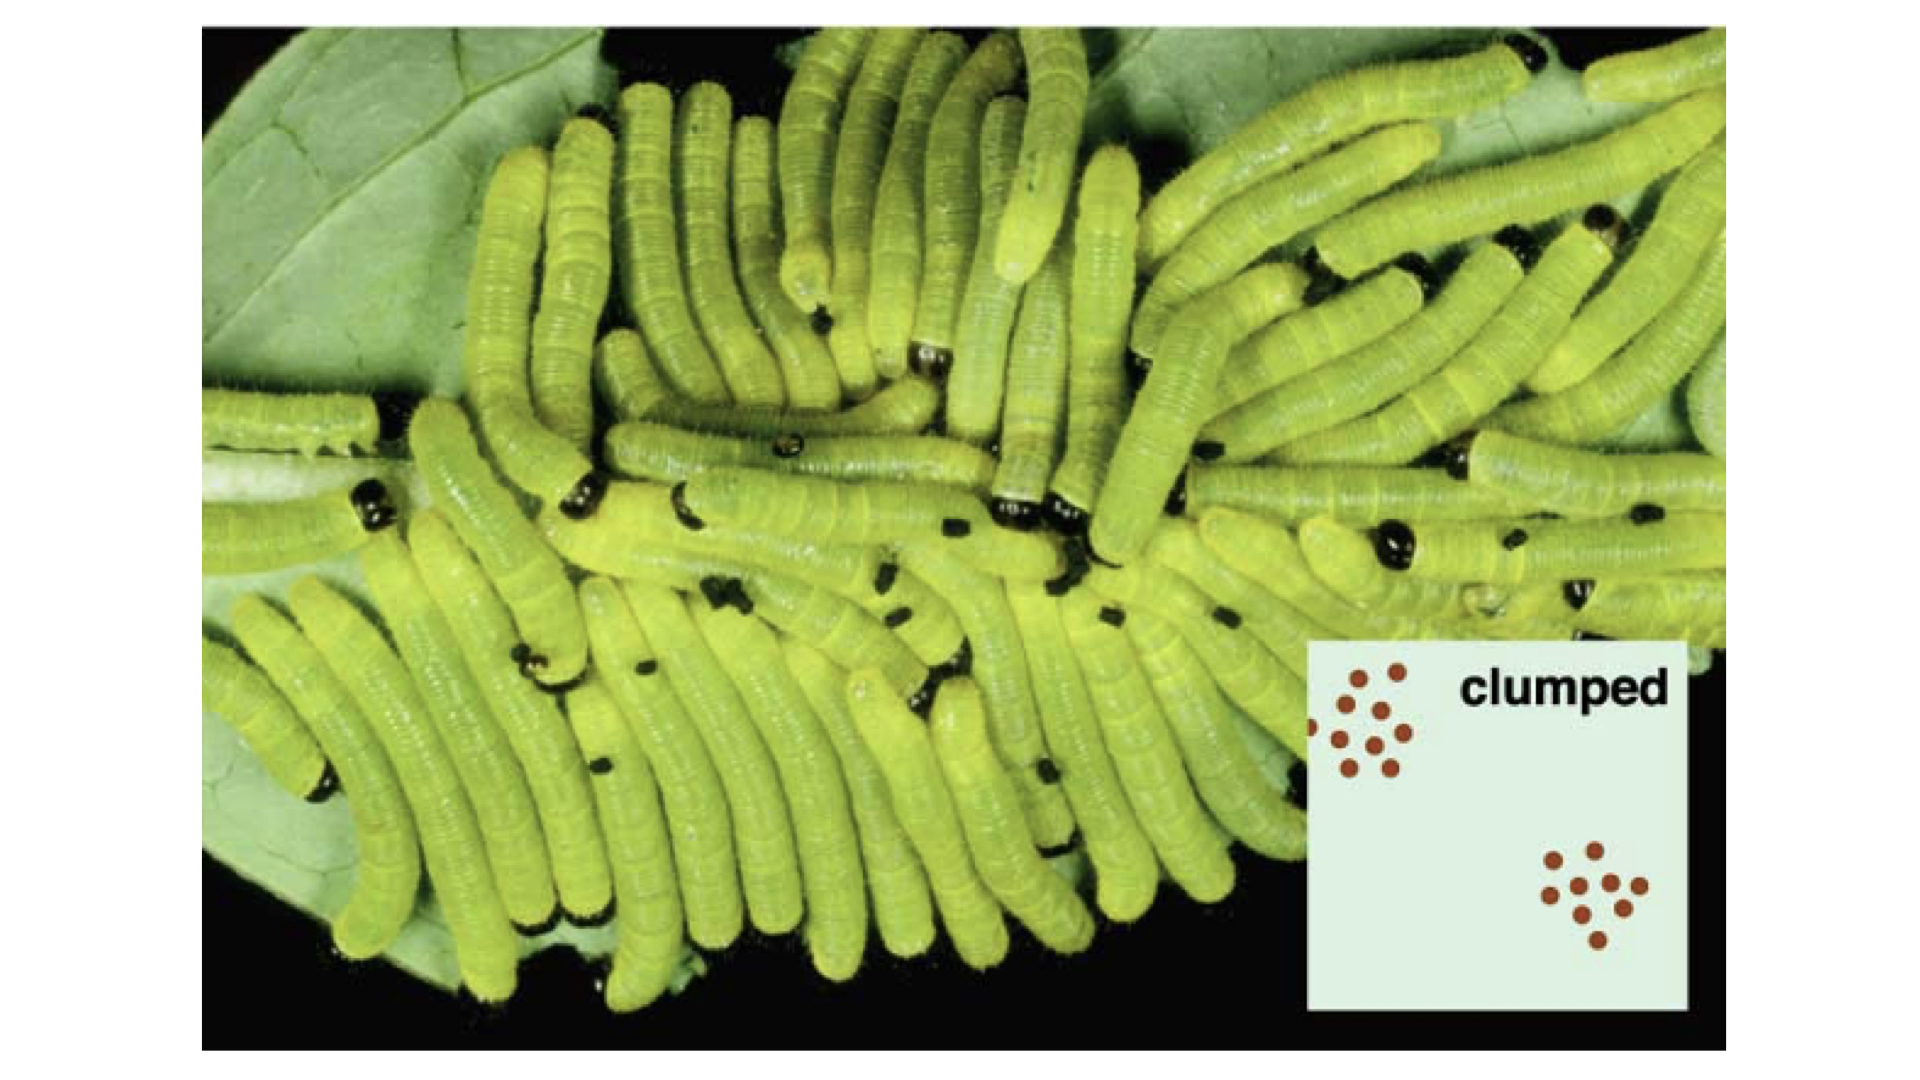
Populations can be dispersed in three patterns.
1. It is very common for members of a population to live in clumps for these reasons:
a. Suitable physical, chemical, and biological conditions are patchy, not uniform.
b. Many animals form social groups.
c. Many offspring are not highly mobile and are forced to live “where they landed.”
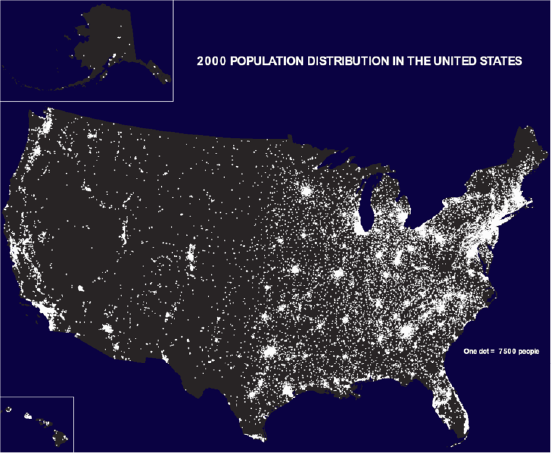
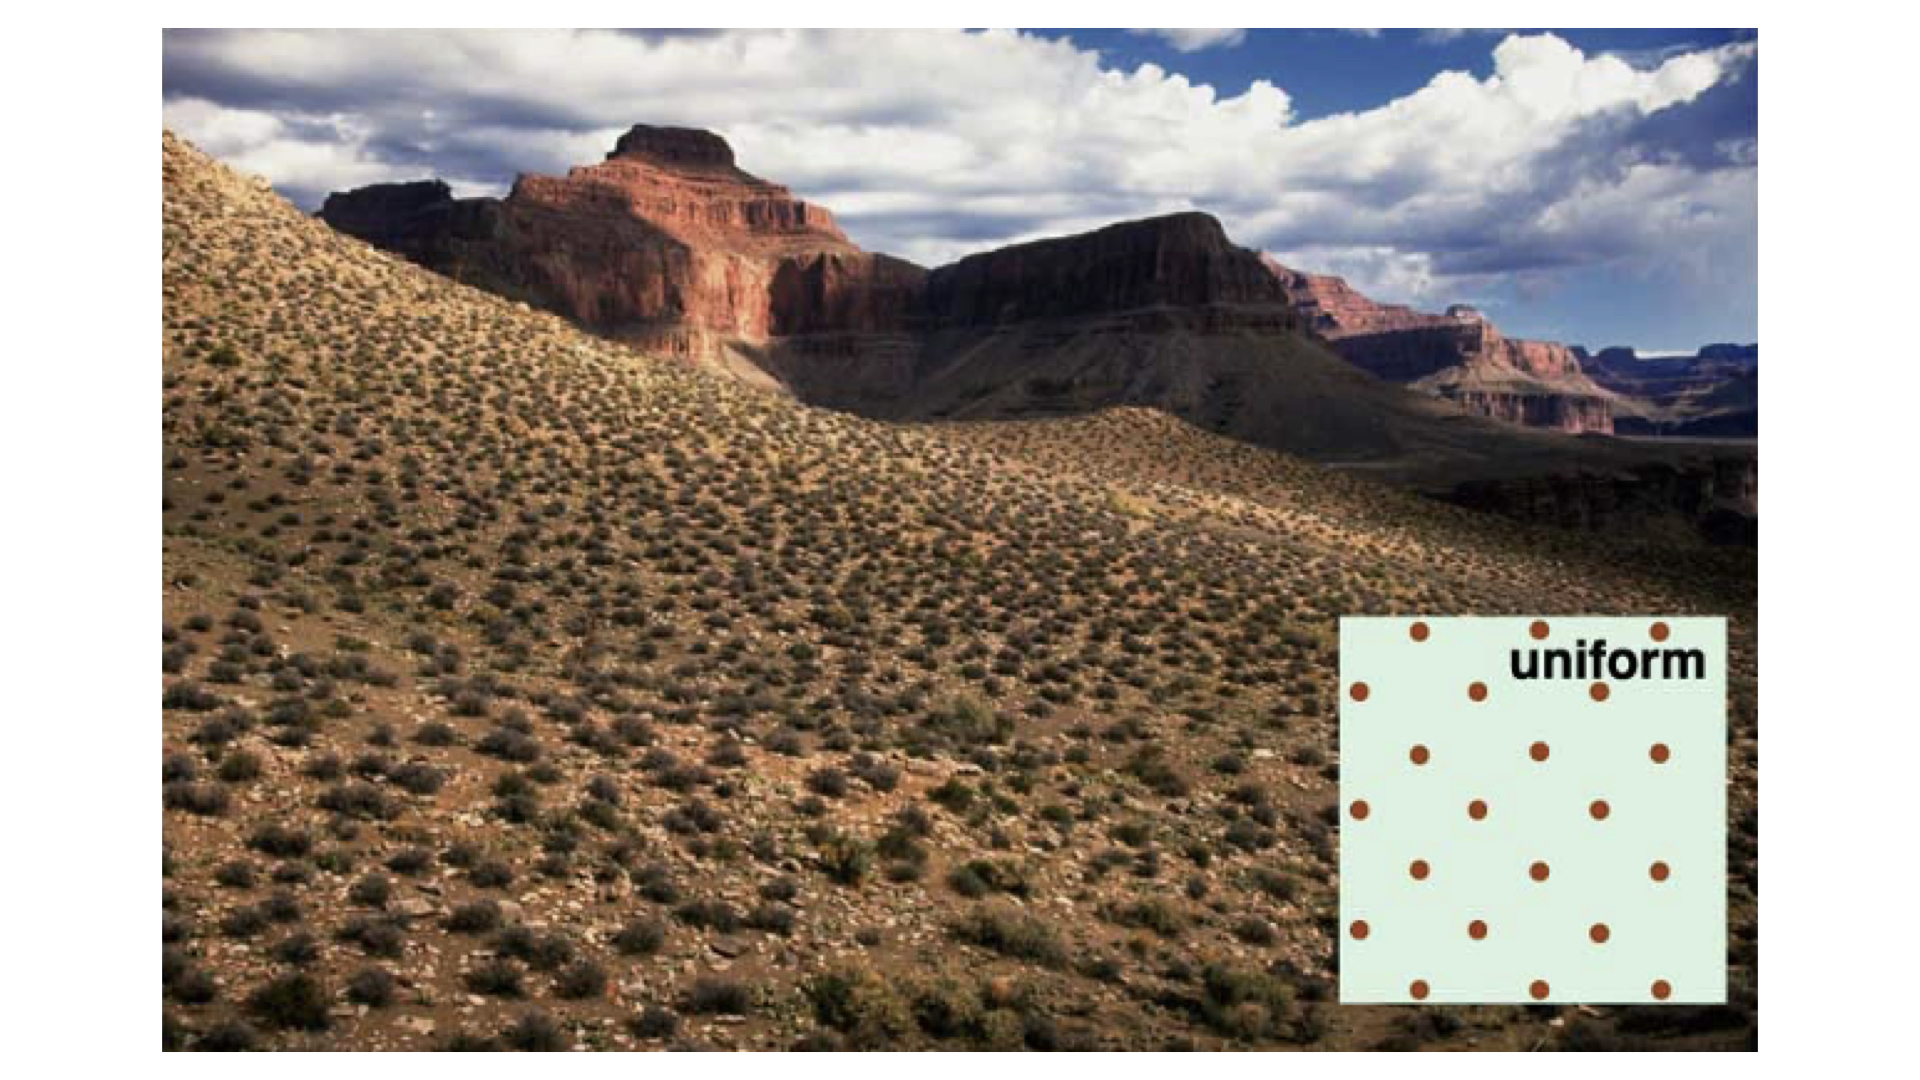
2. Uniform dispersion is rare in nature; when it does occur, it is usually the result of fierce competition for limited resources.
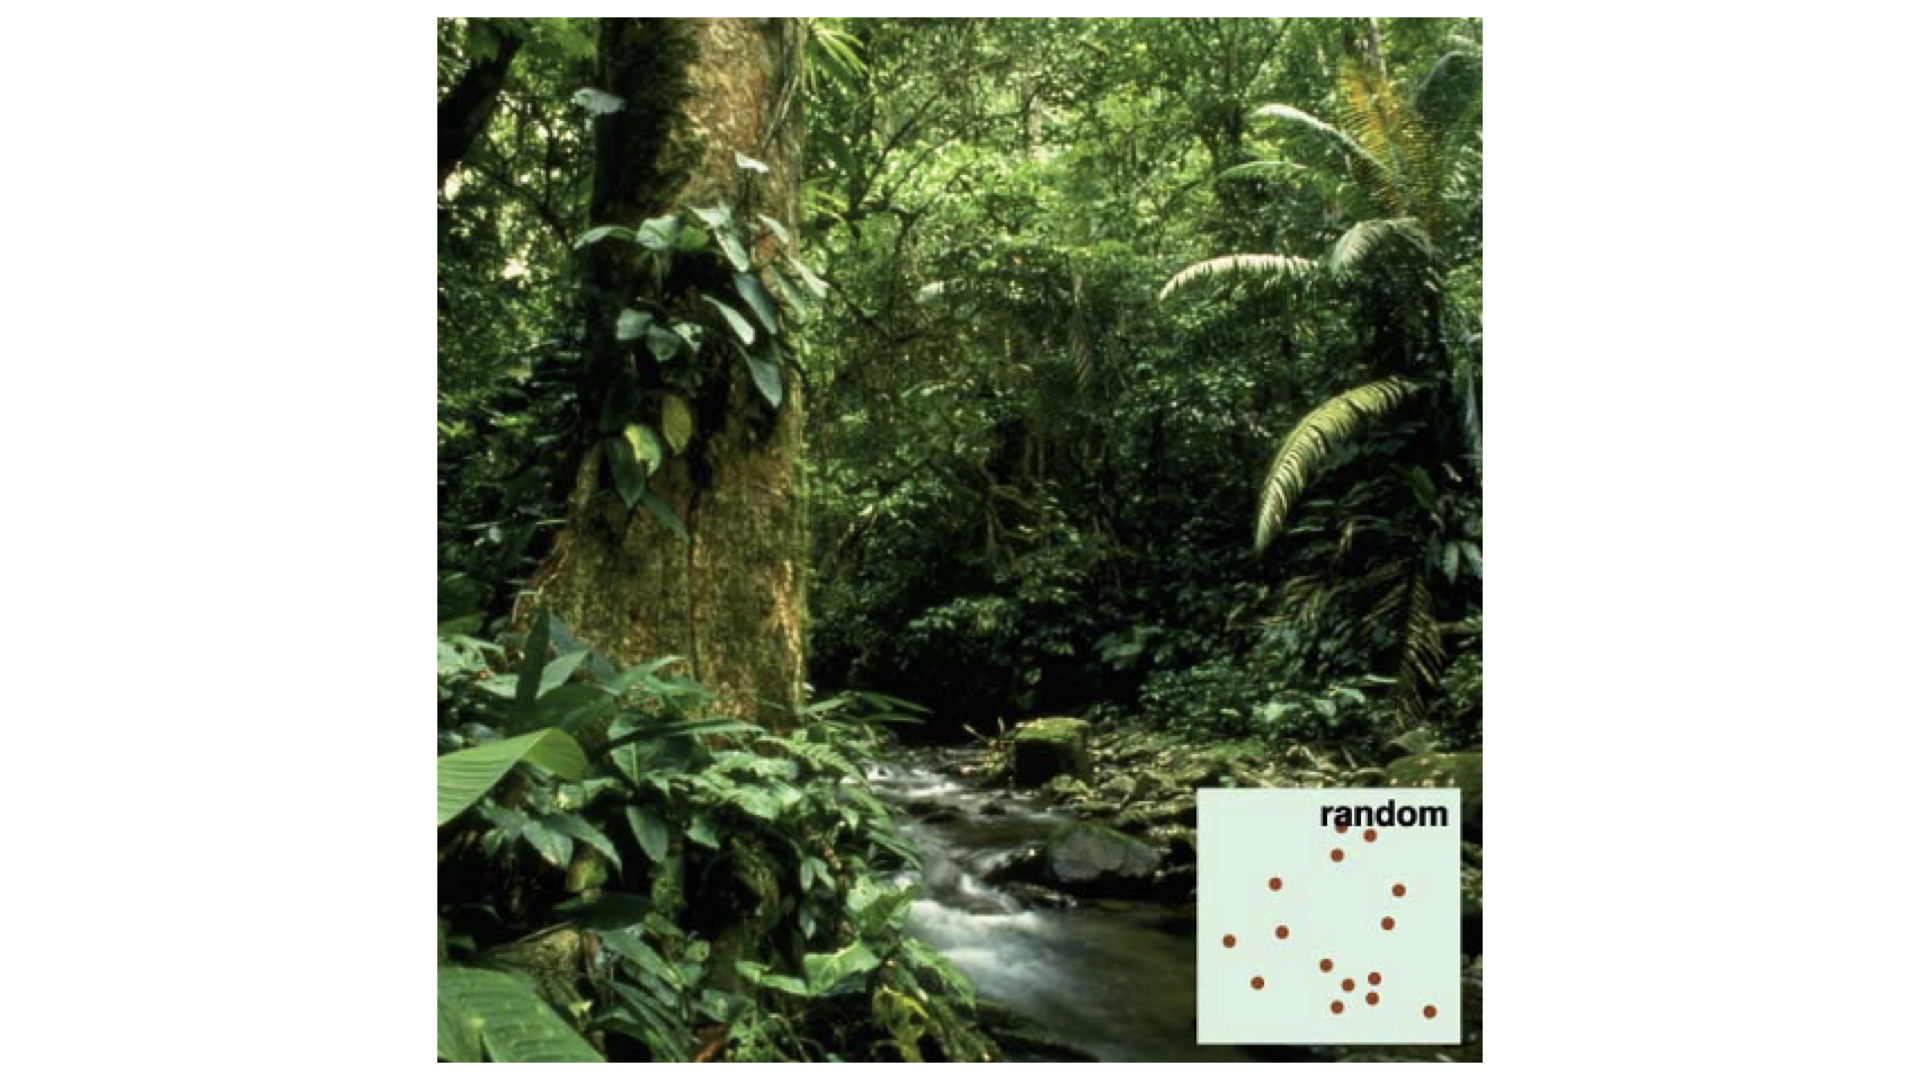
3. Random dispersion occurs in nature if equal environmental conditions are in the habitat and members are neither attracting nor repelling each other.
To understand your population and how it may change, you need to know how many individuals there are. There are three basic methods to determine that number.
1. To determine the number of animals in a particular area, you could try a full count to measure absolute density; this may be impractical for the study of large areas or small species, so scientists sample part of the population and estimate total density.
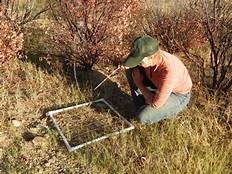
2. The area may be divided into smaller quadrats (usually one square meter but other sized areas may be used as appropriate. Count the number of deer or specific plants in one quadrat and extrapolate the number for the whole area.
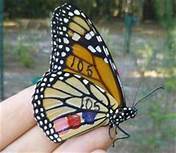
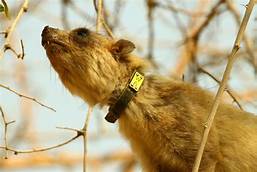
 3. Because many animals migrate a lot, it may be better to use the capture–recapture method where animals are captured and marked in some way, then released. The proportion of marked recaptured animals is proportional to population size. This method assumes that the marking procedure does not affect the survival of the animals.
 Captain Kirk is introduced to exponential growth
Of course, population sizes are not a constant. They continually change based on births, immigration, deaths, and emigration. Population size may also change on a more predictable basis as a result of daily or seasonal migrations. More technically, we want to know the change in population size ( where dN refers to the number of individuals--d = delta). Since we want to know this from some beginning time to some end time, we can call this the change in time or dT.
There are two basic models of population growth, exponential growth (J shaped curve) and logistic growth (S shaped curve). Go to this link on k and r selected populations that compares these two basic reproductive strategies in animals (do not worry about the equations at the beginning--read the descriptions of how the population grows under the two sets of conditions).
This same link also details the factors that affect population growth, both density dependent and density independent.
Environmental Factors Affecting Populations
There are two types of factors that can be limitations on population growth. One is density dependent and the other density independent. As you can tell from the names, the effects of the factor depends on the size of the population or not. Density dependent factors would be things like food, shelter, oxygen. The more individuals, the greater the effect. Density independent factors effect every organism the same regardless of how many. An avalanche effects every organism in its path regardless of numbers.
Density-independent factors often cause fluctuations in populations, but seldom control them:
| Examples of Density-independent factors | Some percent of the population is killed regardless of size or there is a fractional decrease in either birthrate or survival |
| Severe winter | |
| drought | |
| flood | |
| pesticides |
Density-dependent factors usually bring about population control.
| Examples of Density-dependent factors | The bigger (denser) the population, the greater the % effected. |
| Disease | |
| Predators whose population is dependent on food supply | 1% of pop of 10,000 |
| crowding/stress factors | 20% of 100,000 |
| Food/starvation relationships | 80% of 1,000,00 |
Both r - Selected and K - Selected populations are affected by both density-dependent and density-independent environmental factors. Density-independent factors like severe weather may cause big drops in populations (even local extinction) but seldom serve as the major factor controlling the population. Density-dependent factors control the level of most populations. For K - Selected species, they are usually intra-specific factors like territoriality or competition. For r - Selected species , they are more likely to be inter-specific factors like disease or predation.
The following links will cover population growth in more detail. To better understand the concept of carrying capacity, go to this web page that explains what the concept means and how it impacts population growth.
One of the best tutorials on Population Dynamics is located at the Connecting Concepts website of the University of Wisconsin. Do all three topics of this tutorial to ensure you understand this topic.
When we look at all the populations of different organisms within a given area, we call that the community. When we focus on the community, we are concerned with the interactions between the various organisms.
We will cover that aspect in more detail under Ecosystems. However, two concepts that are important to address now are habitat and niche. Habitat can be simplified to a particular species "address"--where you would go to find it.
Its niche is its "profession"--what role it fills in that ecosystem.
Generally, as long as two species occupy different niches, even within the same habitat, they don't compete with each other directly. If the niches overlap, there will be competition. the result of this competition may be the eventual removal of that species from the habitat. The more diverse the habitat, the more niches will be present and the more populations of different species. The largest contributor to the number of endangered species is habitat loss. When its habitat is removed, the species has nowhere to go.
US and world population growth--RIGHT NOW--CLOCK.
Is this growth curve exponential or logistic? What is the planetary carrying capacity? What factors impact that? Remember back to the density dependent and independent factors that affect population.
There are numerous web sites that keep updated information:
United Nations - Global Issues-Population
CIA Report on Population Impacts
Overview of Demographic Concepts and Methods -- United Nations Statistics Division
1. Each species has a life history pattern that influences survival, fertility, and the age of first reproduction.
2. Life Tables - Life tables follow the fate of a group of newborn individuals (cohort) through their lives to calculate the survivorship schedule. The number of offspring born to individuals in each age interval is also recorded.
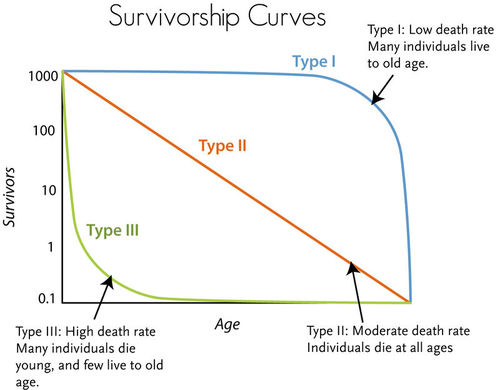
3. Patterns of Survival and Reproduction - Survivorship curves are plots of the age-specific patterns of death for a given population in a given environment. Most animals are characterized by one of these types of curves.
a. A Type I curve is typical of large mammals, where few offspring are produced and cared for so that infant mortality is low; death usually comes after an extended life.
b. A Type II curve is typical of many animals, where the chances of survival or death are about the same at any age.
c. A Type III curve indicates low survivorship, or conversely, high mortality in early life.
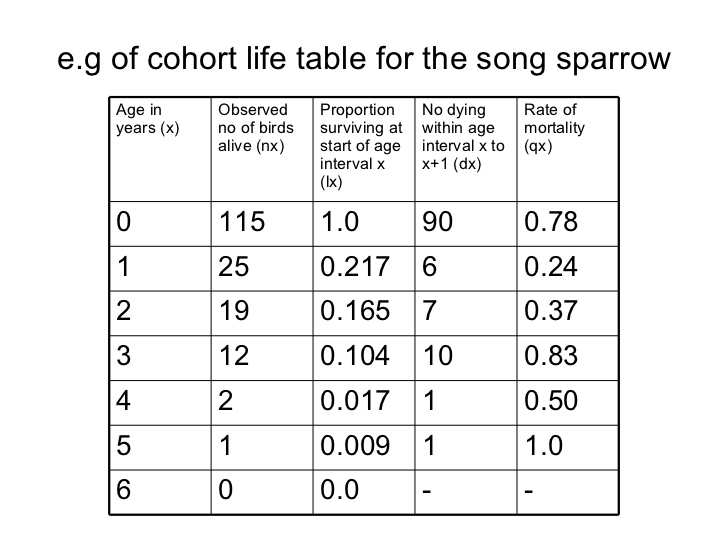
. Similar types of tables are used by insurance companies to determine rates for people at different ages (risk categories)
4. Natural Selection and Life Histories
A. David Reznick and John Endler studied the differences in size and survival of guppies in Trinidad. They were interested in the effects of predation on guppy populations in two streams with different predators. Their hypothesis was that predation by killifish and pike-cichlids is a selective agent that acted to shape guppy life history patterns.
B. They discovered that differences in growth rate and reproductive maturity have a genetic basis because the effects were the same in lab-reared guppies and the natural populations.
C. The experimenters performed other field experiments that stretched over 11 years. Guppies that had been exposed to one predator and then moved to another displayed changes. Reznick and Endler showed that life history traits can be inherited, but these traits can also evolve.
5. Fertility Rates and Age Structure
A. At the present rate of increase, the world human population may reach 8.9 billion by 2050.
1. The total fertility rate (TFR) is the average number of children born to women during their reproductive years, and is currently 2.8 children per female.
2. Even if the replacement level of fertility is achieved (about two children per woman), the human population will continue to grow for another 60 years.
B. Any population with a broadly based age structure (many women in reproductive years) will continue explosive population growth.
1. Effective family planning programs can achieve a faster decline in birth rate than economic development alone. China and India have been most active in this area.
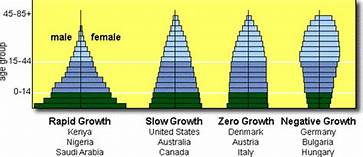
These fertility and age structure diagrams can be used to help predict future population growth.